




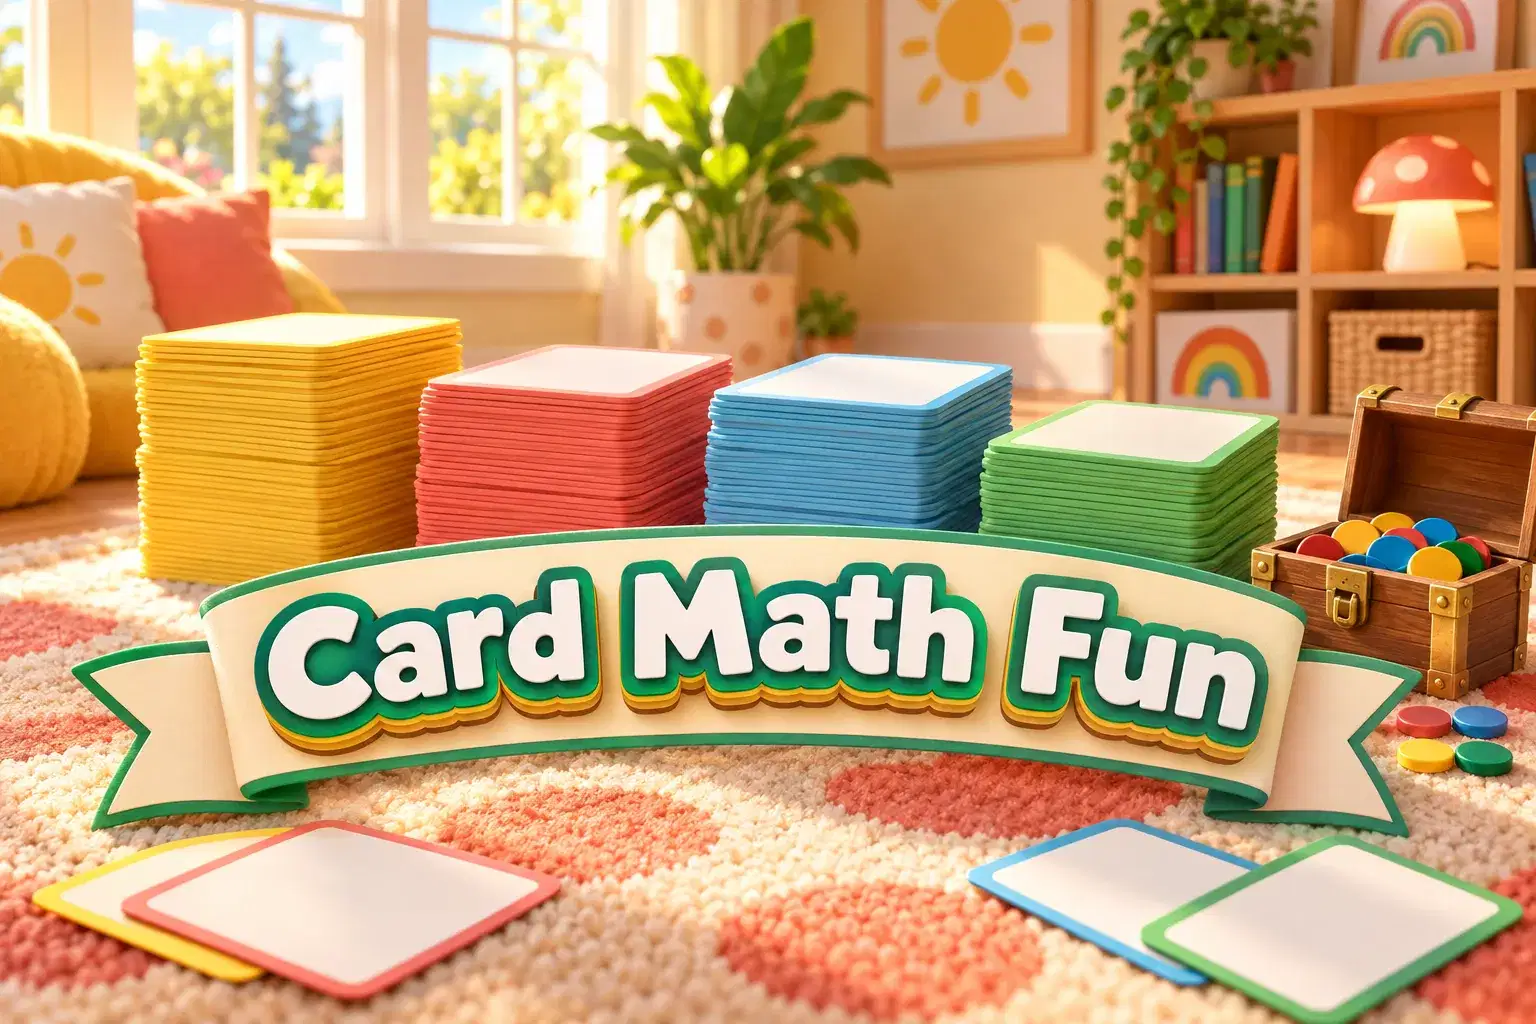
Pokémon Card Math: One-Day Class
Laxman Shastri Joshi
Ages 6–8 · 30 min · 1 / Week
$19.00per classSee schedule

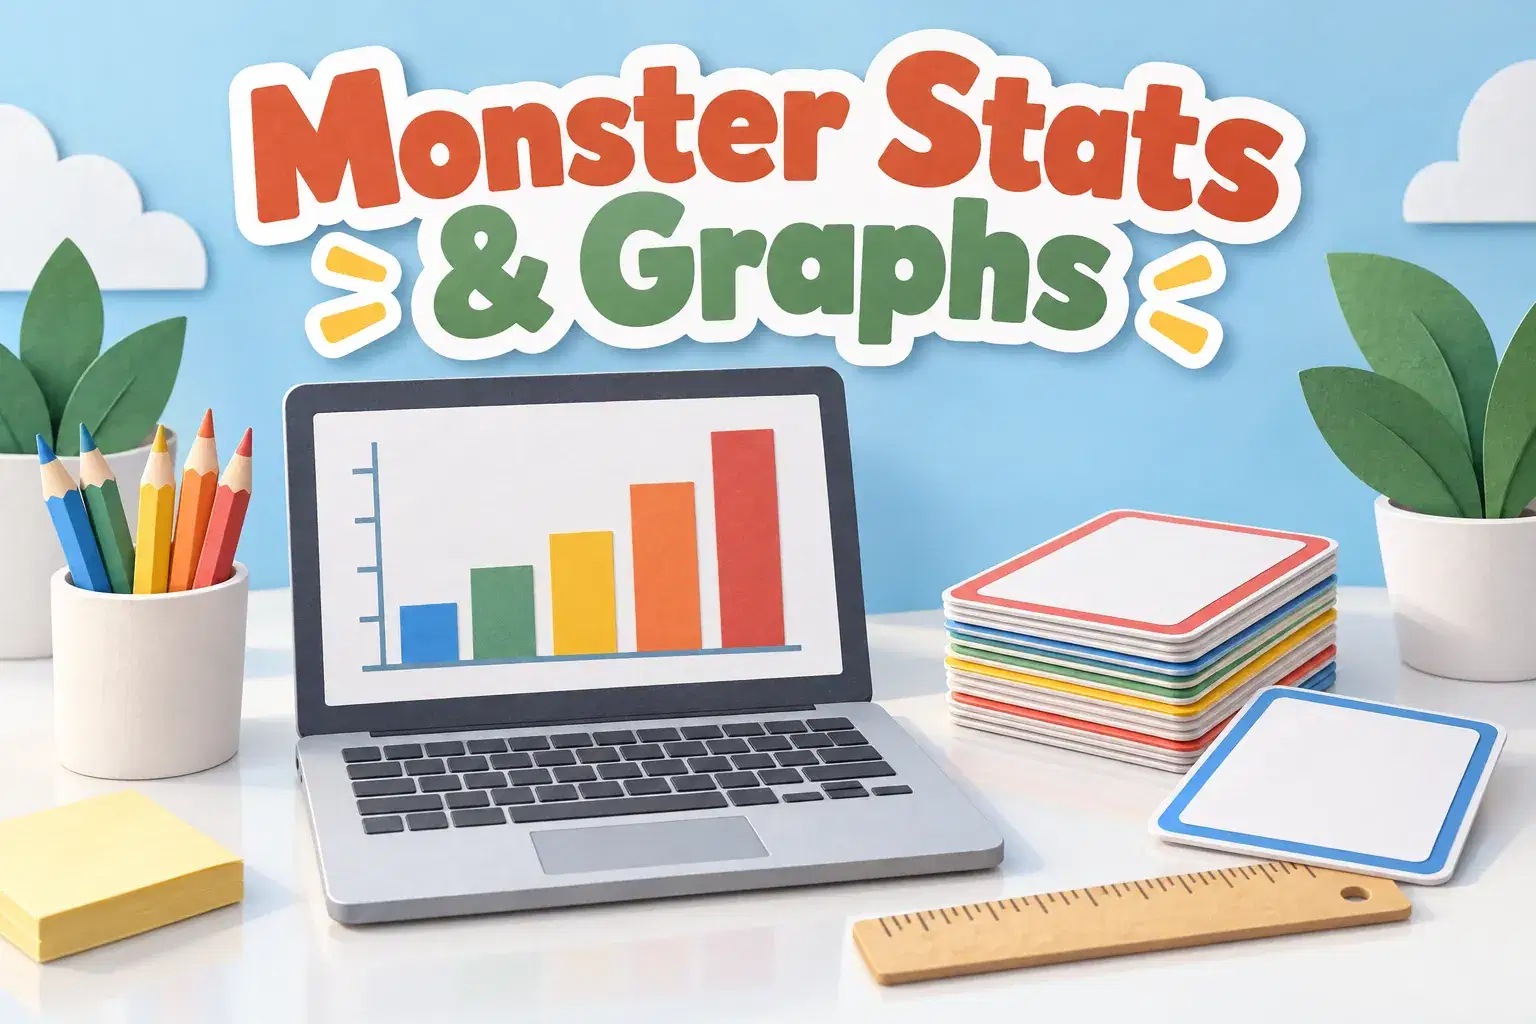
A four-week data course for grades 4-6. Learners collect game stats in Roblox, organize them in tables, make bar and line graphs and find mean, median and mode.
Paid once.
Games are full of numbers, from scores and speeds to how many coins players collect. In this four-week course learners in grades 4 to 6 become data analysts, collecting stats from Roblox games and turning them into tables and graphs.
In week one learners learn how to ask a good data question, such as which obby section causes the most falls. They play a teacher-built Roblox world, record data in a tally chart and organize it in a table. Week two focuses on graphs. Learners create bar graphs and pictographs from their data and learn when each type is most useful. In week three they track changes over time, such as their score across several rounds, and make line graphs to spot trends. The final week introduces mean, median, mode and range, and learners use them to compare results between classmates.
Learners finish with a short data report that answers their original question and suggests a change to the game based on the evidence. The teacher explains each idea with clear examples and shows how game designers really use data to improve their games.
By the end learners will collect, organize, graph and summarize data with confidence. No coding is required.
Each class starts with a data question and short lesson, then learners collect stats in a Roblox world and build graphs. Learners share findings at the end.
Week 1: Data Questions and Tallies – Ask a question and collect game data in a tally chart.
Week 2: Bar Graphs and Pictographs – Graph data and choose the best graph type.
Week 3: Line Graphs – Track scores over rounds and spot trends.
Week 4: Mean, Median, Mode and Report – Summarize data and write a short evidence report.
Write a clear data question
Collect and organize data in tables
Create bar graphs pictographs and line graphs
Find mean median mode and range
Use evidence to recommend a game change
Learners should be comfortable with addition, subtraction and basic division. Roblox Studio installed.
Trisha is a mathematics educator who designs private Roblox experiences to make addition and subtraction intuitive for 7-10-year-olds. She structures each session as a sequence of short, goal-oriented game challenges that pair hands-on virtual manipulatives with explicit strategy…
Laxman Shastri Joshi
Ages 6–8 · 30 min · 1 / Week
$19.00per classSee schedule

Parmeshwari Devi
Ages 9–12 · 55 min · 4 / Week
$19.50per classSee schedule
Snehalata Devi
Ages 9–12 · 50 min · 1 / Week
$19.75per classSee schedule
Dinanath Mangeshkar
Ages 7–10 · 45 min · 1 / Week
$19.75per classSee schedule

Shreya Reddy
Ages 11–14 · 55 min · 1 / Week
$19.75per classSee schedule

Siddharth Iyengar
Ages 9–13 · 55 min · 1 / Week
$19.75per classSee schedule
Laxman Shastri Joshi
Beginner
Level
6–8
Ages
30 min
Duration
1 / Week
Classes
1
Weeks
Malati Devi
Beginner
Level
9–12
Ages
45 min
Duration
1 / Week
Classes
4
Weeks
Memcha Devi
Beginner
Level
8–11
Ages
45 min
Duration
1 / Week
Classes
4
Weeks
Parmeshwari Devi
Beginner
Level
9–12
Ages
55 min
Duration
4 / Week
Classes
1
Weeks
Snehalata Devi
Beginner
Level
9–12
Ages
50 min
Duration
1 / Week
Classes
4
Weeks
Dinanath Mangeshkar
Beginner
Level
7–10
Ages
45 min
Duration
1 / Week
Classes
4
Weeks
Shreya Reddy
Intermediate
Level
11–14
Ages
55 min
Duration
1 / Week
Classes
8
Weeks
Siddharth Iyengar
Intermediate
Level
9–13
Ages
55 min
Duration
1 / Week
Classes
8
Weeks